Odd & Even Policy Operational Dashboard

Overview
Urban traffic congestion remains one of the biggest challenges for city governments, affecting both mobility and quality of life. To help address this, Teman Data partnered on a project aimed at evaluating the effectiveness of the Odd & Even license plate policy, a regulation designed to reduce congestion in major urban areas. We developed an integrated real-time dashboard, supported by multiple data sources, that provided policymakers with a clear and timely view of traffic conditions. To ensure usability, the system was designed around a Figma prototype reference, aligning with how decision-makers interact with data.
Challenge
Before this project began, city officials didn’t have a reliable way to see what was happening on the roads in real time. Traffic data was scattered across different departments, making it hard to tell whether the Odd & Even license plate rule was actually helping reduce congestion.
Because there wasn’t a single, unified view of traffic conditions, planners couldn’t easily adjust routes, weigh the pros and cons of the policy, or respond quickly to daily traffic issues. Instead, they had to rely on outdated reports, which slowed down decision-making and made it harder to manage the city’s traffic effectively.
Solution
Teman Data helped city officials take control of traffic by bringing together different sources of information—like live traffic updates, rule compliance, and past patterns—into one easy-to-use dashboard. This tool was built specifically to help assess how well the Odd & Even license plate policy was working.
With clear visuals and real-time updates, decision-makers could instantly spot traffic jams, see where the policy was making a difference, and track new trends as they happened. No more waiting for delayed reports or juggling data from different departments.
The results were immediate. City teams could now make faster, smarter decisions—adjusting traffic strategies on the fly, using resources more efficiently, and planning for the future with confidence. By turning scattered data into clear insights, the dashboard became a powerful tool for improving how cities manage mobility every day.
Output
- Integrated live traffic, environmental, and vehicle data
- Built a visual dashboard with predictive models for congestion
- Triggered alerts for law enforcement and planning authorities
- Highlighted traffic trends and impact of policy measures
Impact
- Reduced manual reporting time by 60%
- Enhanced infrastructure planning capability
- Enabled real-time responses to congestion
Portfolio

Corporate Business Review Dashboard
Teman Data developed a comprehensive dashboard that consolidates all essential business metrics—such as Whole Sales, Retail Sales, OPEX, CAPEX, and more—into a single, interactive platform tailored to the…

Enterprise Financial & Commercial Analytics Platform
Teman Data developed a dashboard for the client to allows the users has a quick access to crucial information such as net profit, revenue, costs, performance, KPI. This…
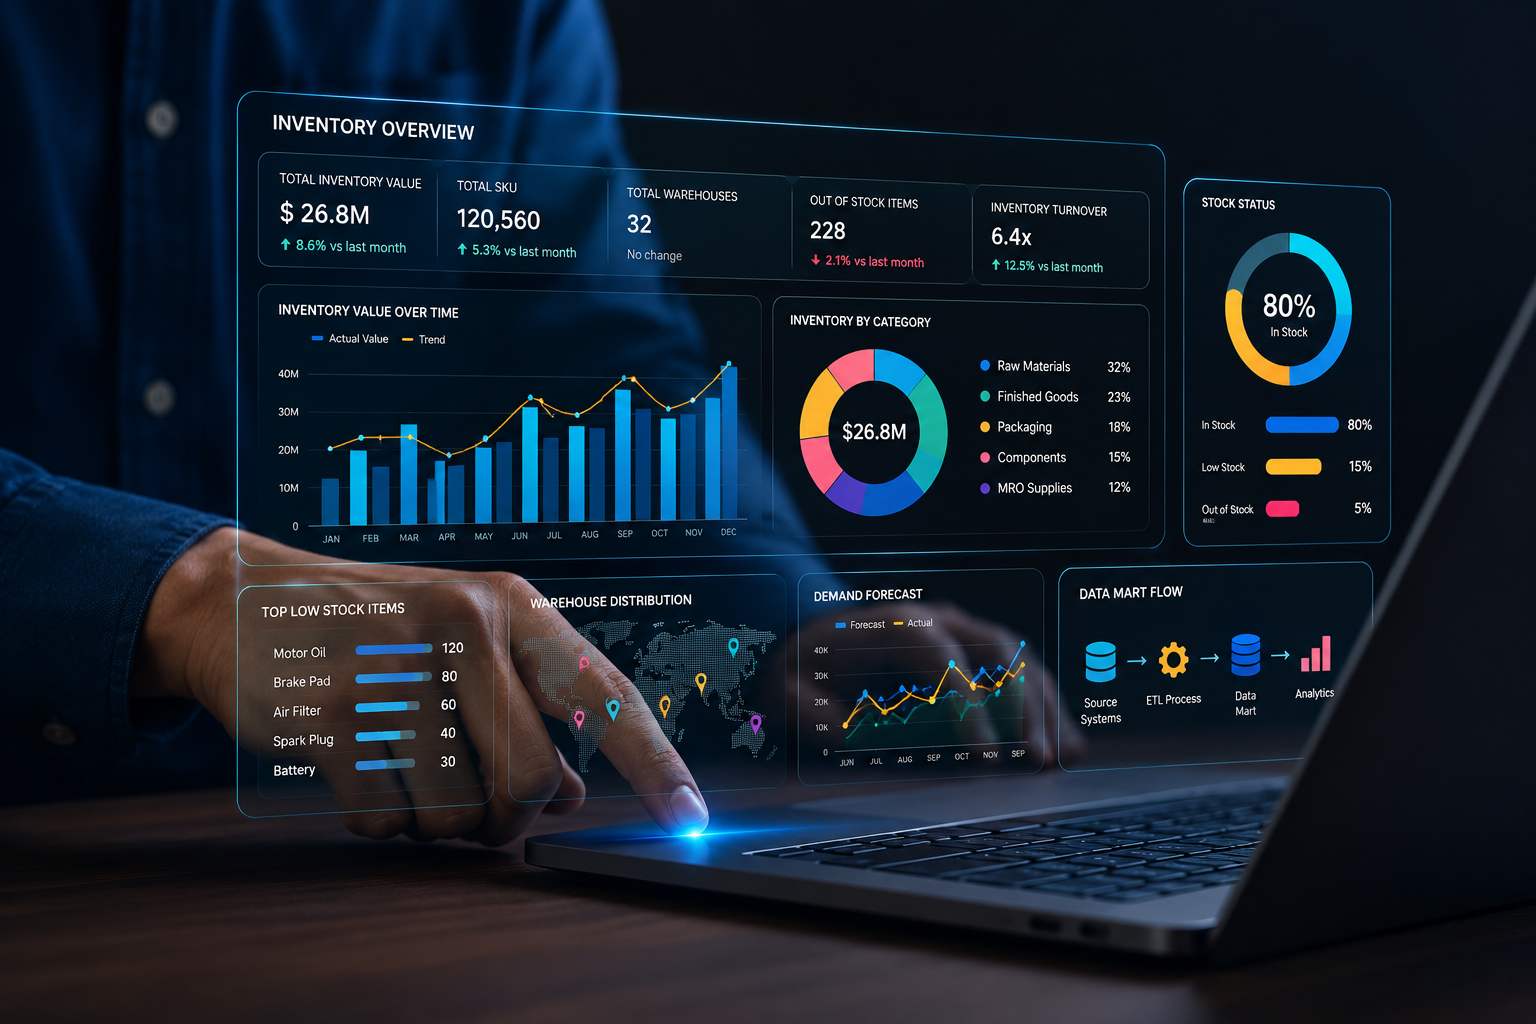
Inventory Report Dashboard and Data Mart
Teman Data partnered with Toyota Astra Motor to develop a dashboard that tracks car inventory throughout the entire supply chain—from import or production all the way to dealer…
Ready to go further with Teman Data?
Smarter care, fewer delays. Teman Data unifies patient, staff, and resource data to cut wait times, boost efficiency, and improve outcomes.
Tailor solutions to your goals, making data simple, scalable, and truly actionable.
OTHERS
©2026 Teman Data. All Rights Reserved